Moisture Damage
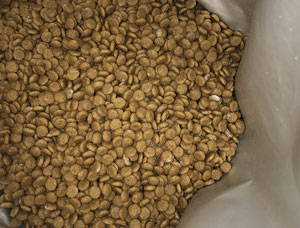
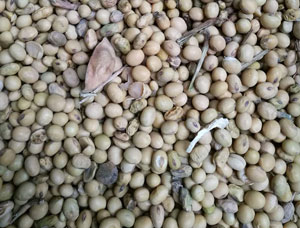
For many years, thousands of containerized cargoes are damaged by moisture problems. When the containers arrive at the destination, metal is found to be rusty or oxidated, cartons become soft and moldy, bulk coffee, cocoa, beans may be damp, musty…,such losses sometimes costs several million dollars. It is caused by two main reasons: Container Rain and Cargo Sweat.
Four Areas of container moisture damage:
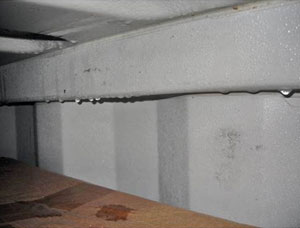
1. The ceiling and inner walls of the container, the condensation is known as “Container Rain”
2. The surface of cargo, the condensation is known as “Cargo Sweat”
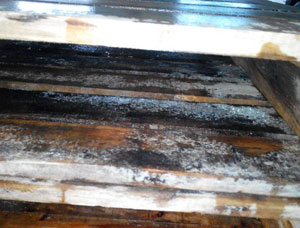
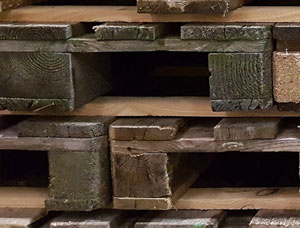
3. The container floor. There are two kinds, iron floor is cold, wooden floor contains moisture inside. They both easily make the pallets moldy.
4. The container doors. The outside wet air easily goes through the crack of the container door and causes high relative humidity.
Container Rain
Moldy Pallets
Water vapor content in the air at different temperature and RH
| RH T(℃) |
100% | 90% | 80% | 70% | 60% | 50% | 40% | 30% | 20% | 10% |
| 65 | 160.3 | 144.3 | 128.2 | 112.2 | 96.2 | 80.2 | 64.1 | 48.1 | 32.1 | 16.0 |
| 60 | 129.6 | 116.6 | 103.7 | 90.7 | 77.8 | 64.8 | 51.8 | 38.9 | 25.9 | 13.0 |
| 55 | 103.9 | 93.5 | 83.1 | 72.7 | 62.3 | 52.0 | 41.6 | 31.2 | 20.8 | 10.4 |
| 50 | 82.7 | 74.4 | 66.2 | 57.9 | 49.6 | 41.4 | 33.1 | 24.8 | 16.5 | 8.3 |
| 45 | 65.2 | 58.7 | 52.2 | 45.6 | 39.1 | 32.6 | 26.1 | 19.6 | 13.0 | 6.5 |
| 40 | 50.9 | 45.8 | 40.7 | 35.6 | 30.5 | 25.5 | 20.4 | 15.3 | 10.2 | 5.1 |
| 35 | 39.2 | 35.3 | 31.4 | 27.4 | 23.5 | 19.6 | 15.7 | 11.8 | 7.8 | 3.9 |
| 30 | 30.0 | 27.0 | 24.0 | 21.0 | 18.0 | 15.0 | 12.0 | 9.0 | 6.0 | 3.0 |
| 25 | 22.8 | 20.5 | 18.2 | 16.0 | 13.7 | 11.4 | 9.1 | 6.8 | 4.6 | 2.3 |
| 20 | 17.1 | 15.4 | 13.7 | 12.0 | 10.3 | 8.6 | 6.8 | 5.1 | 3.4 | 1.7 |
| 15 | 12.7 | 11.4 | 10.2 | 8.9 | 7.6 | 6.4 | 5.1 | 3.8 | 2.5 | 1.3 |
| 10 | 9.3 | 8.4 | 7.4 | 6.5 | 5.6 | 4.7 | 3.7 | 2.8 | 1.9 | 0.9 |
| 5 | 6.8 | 6.1 | 5.4 | 4.8 | 4.1 | 3.4 | 2.7 | 2.0 | 1.4 | 0.7 |
| 0 | 4.8 | 4.3 | 3.8 | 3.4 | 2.9 | 2.4 | 1.9 | 1.4 | 1.0 | 0.5 |
| -5 | 3.2 | 2.9 | 2.6 | 2.2 | 1.9 | 1.6 | 1.3 | 1.0 | 0.6 | 0.3 |
| -10 | 2.1 | 1.9 | 1.7 | 1.5 | 1.3 | 1.1 | 0.8 | 0.6 | 0.4 | 0.2 |
| -15 | 1.4 | 1.3 | 1.1 | 1.0 | 0.8 | 0.7 | 0.6 | 0.4 | 0.3 | 0.1 |
| -20 | 0.9 | 0.8 | 0.7 | 0.6 | 0.5 | 0.5 | 0.4 | 0.3 | 0.2 | 0.1 |
|
According to the above table we can calculate moisture content in the air in the containers/cartons before shipment. Statement: |
||||||||||
Temperature, Rainfall and Rainfall Days Records
| BEIJING | SHANGHAI | ||||||||
| Temperature | Total | Days | Temperature | Total | Days | ||||
| Month | Lowest | Highest | Rainfall | Rainfall | Month | Lowest | Highest | Rainfall | Raining |
| /day | /day | mm | Days | /day | /day | mm | Days | ||
| Jan | -9.4 | 1.6 | 3 | 2 | Jan | 0.5 | 7.7 | 39 | 9 |
| Feb | -6.9 | 4.0 | 6 | 3 | Feb | 1.5 | 8.6 | 59 | 10 |
| Mar | -0.6 | 11.3 | 9 | 4 | Mar | 5.1 | 12.7 | 81 | 13 |
| Apr | 7.2 | 19.9 | 26 | 5 | Apr | 10.6 | 18.6 | 102 | 13 |
| May | 13.2 | 26.4 | 29 | 6 | May | 15.7 | 23.5 | 115 | 13 |
| Jun | 18.2 | 30.3 | 71 | 9 | Jun | 20.3 | 27.2 | 152 | 14 |
| Jul | 21.6 | 30.8 | 176 | 14 | Jul | 24.8 | 31.6 | 128 | 12 |
| Aug | 20.4 | 29.5 | 182 | 12 | Aug | 24.7 | 31.5 | 133 | 10 |
| Sep | 14.2 | 25.8 | 49 | 7 | Sep | 20.5 | 27.2 | 156 | 12 |
| Oct | 7.3 | 19 | 19 | 5 | Oct | 14.7 | 22.3 | 61 | 9 |
| Nov | -0.4 | 10.1 | 6 | 3 | Nov | 8.6 | 16.7 | 51 | 8 |
| Dec | -6.9 | 3.3 | 2 | 2 | Dec | 2.4 | 10.6 | 35 | 7 |
| GUANGZHOU | XIAMEN | ||||||||
| Temperature | Total | Days | Temperature | Total | Days | ||||
| Month | Lowest | Highest | Rainfall | Lowest | Month | Lowest | Highest | Rainfall | Lowest |
| /day | /day | mm | /day | /day | /day | mm | /day | ||
| Jan | 9.8 | 18.3 | 43 | 8 | Jan | 9.7 | 16.8 | 37 | 8 |
| Feb | 11.3 | 18.4 | 65 | 11 | Feb | 9.8 | 16.5 | 65 | 13 |
| Mar | 14.9 | 21.6 | 85 | 15 | Mar | 11.9 | 18.8 | 99 | 17 |
| Apr | 19.1 | 25.5 | 182 | 16 | Apr | 16.1 | 23 | 147 | 16 |
| May | 22.7 | 29.4 | 284 | 18 | May | 20.3 | 26.7 | 152 | 16 |
| Jun | 24.5 | 31.3 | 258 | 19 | Jun | 23.3 | 29.4 | 196 | 14 |
| Jul | 25.3 | 32.7 | 228 | 16 | Jul | 25.3 | 32.4 | 140 | 10 |
| Aug | 25.2 | 32.6 | 221 | 16 | Aug | 25.2 | 32.2 | 155 | 10 |
| Sep | 23.8 | 31.4 | 172 | 13 | Sep | 23.8 | 30.7 | 117 | 11 |
| Oct | 20.5 | 28.6 | 79 | 7 | Oct | 20.5 | 27.4 | 29 | 3 |
| Nov | 15.7 | 24.4 | 42 | 6 | Nov | 16.4 | 23.4 | 37 | 5 |
| Dec | 11.1 | 20.5 | 24 | 5 | Dec | 11.7 | 19.1 | 25 | 4 |

 Chinese
 English


